ENSO index vs. global temperature
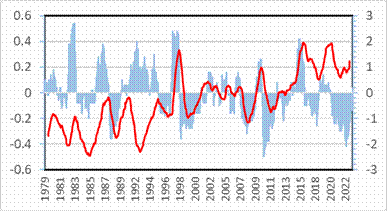
Correlation between temperature and ENSO index during 1979-2022. Temperature (°C, red line): 13-month average of lower troposphere anomaly values by UAH with scales on the left. ENSO index (blue vertical lines): two-month average by NOAA with scales on the right.
Proposed process for El Niño
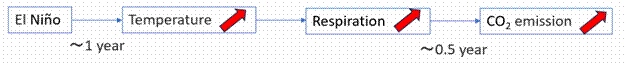
Proposed process for strong El Niño events: an increase in global temperature (ca. 0.5°C), an increase in soil respiration (Rs), and subsequent global CO2 emissions (ca. 4 Gt·C)
CO2 growth rate vs. global temperature
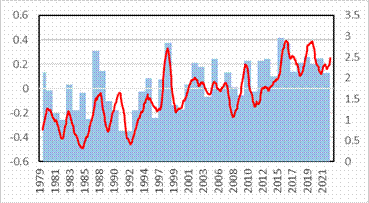
Correlation between temperature and CO2 changes during 1979-2022. Temperature (°C, red line): 13-month average of lower troposphere anomaly values by UAH with scales on the left. CO2 (ppm/year, blue vertical lines): difference from the previous year in annual averages by NOAA with scales on the right.
drco2/dt ≒ γ ΔT (rco2: CO2 concentration, γ: constant, ΔT: temperature change) (1)
ΔT à(0.5-1 year)à Δrco2 (Δrco2: a change in CO2 concentration) (2)
CO2 emission and absorption during El Niño
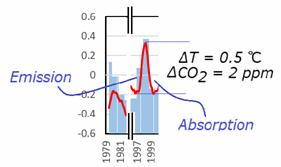
Changes in global temperatures and CO2 concentration growth rate during El Niño in 1997-99
CO2 emission and absorption during cool and warm periods
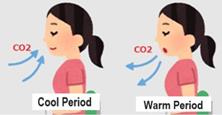
Proposed thermally-induced CO2 absorption and emission processes during cool and warm periods on Earth
Seasonal pattern for the generation of CO2, CH4, and N2O
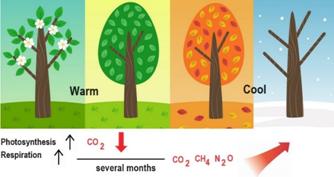
Proposed seasonal pattern for the generation of CO2, CH4, and N2O with a time lag of several months by plant decomposition and soil respiration
ΔT, ΔRs, and ΔCO2
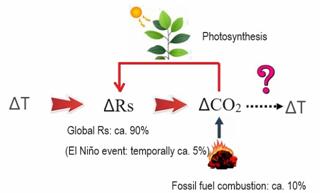
Changes in the carbon cycle (ΔCO2) due to soil respiration (ΔRs) and global temperature (ΔT)
Anthropogenic CO2 in greenhouse gases

Compositional ratio of greenhouse gases in the atmosphere when H2O is assumed to be 1%.