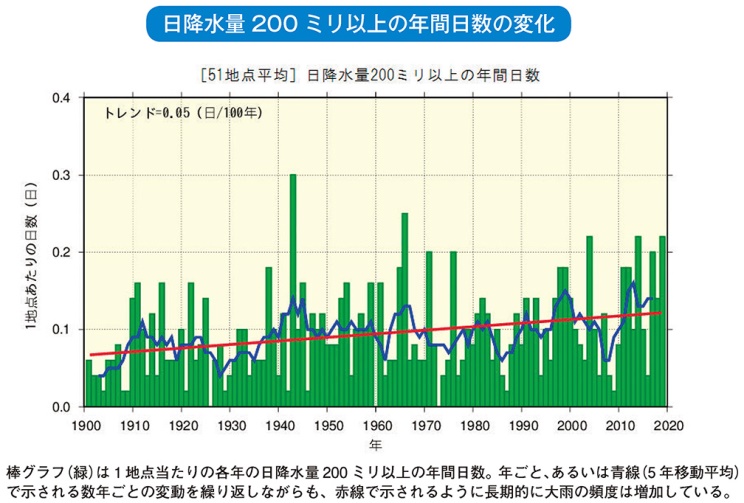
Fig. 1 日本における200 ミリ以上の年間日数の変化
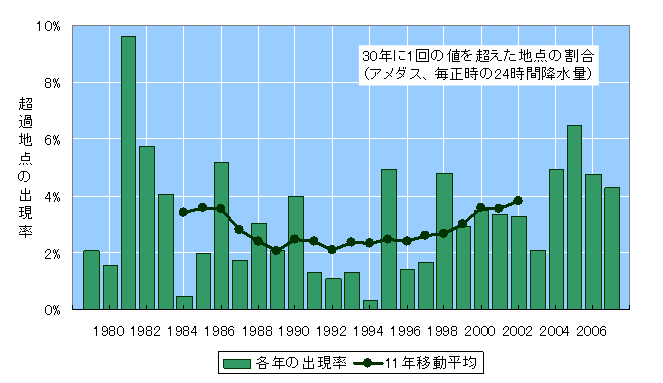
Fig. 2 日本における30年に1回の値を超えた地点の割合
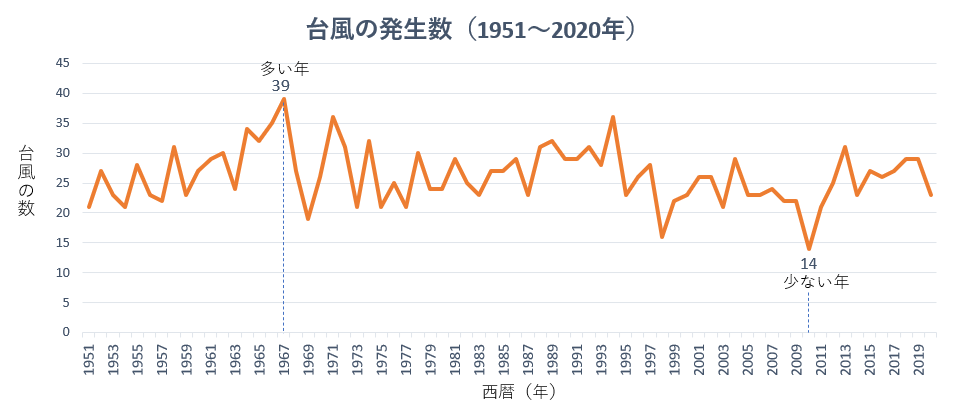
Fig.3 台風の発生数(データは気象庁)
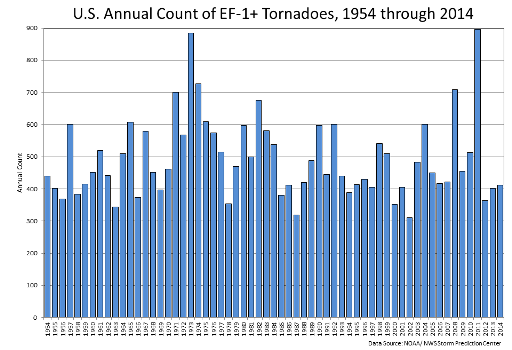
Fig.4 アメリカにおける竜巻の変化、1954-2014
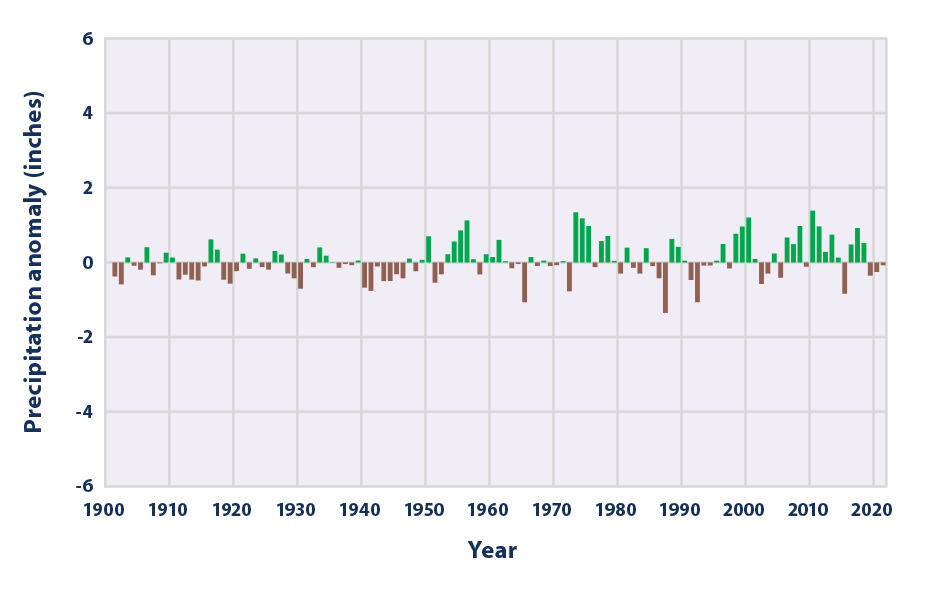
Fig.5 世界の降雨量の変化, 1901–2021
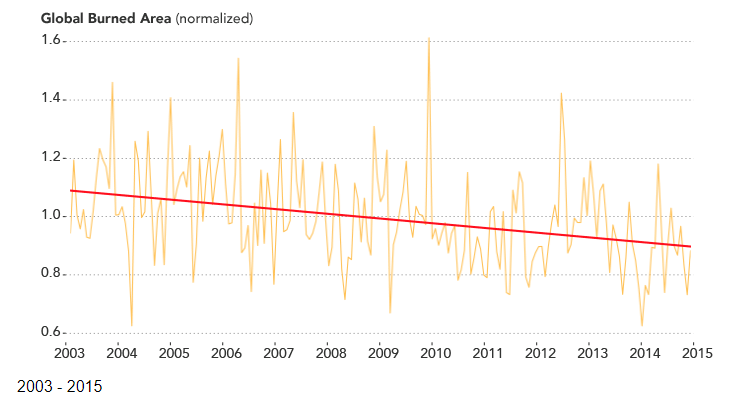
Fig.6 世界の焼失面積の変化
Your email address will not be published. Required fields are marked *
Name *
Email *
Website
Comment
You may use these HTML tags and attributes: <a href="" title=""> <abbr title=""> <acronym title=""> <b> <blockquote cite=""> <cite> <code> <del datetime=""> <em> <i> <q cite=""> <strike> <strong>
<a href="" title=""> <abbr title=""> <acronym title=""> <b> <blockquote cite=""> <cite> <code> <del datetime=""> <em> <i> <q cite=""> <strike> <strong>